


The century-old solar observations from the Kodaikanal Solar Observatory have helped scientists uncover new clues about how giant convection patterns on the Sun respond to solar activity, potentially improving predictions of future solar cycles.
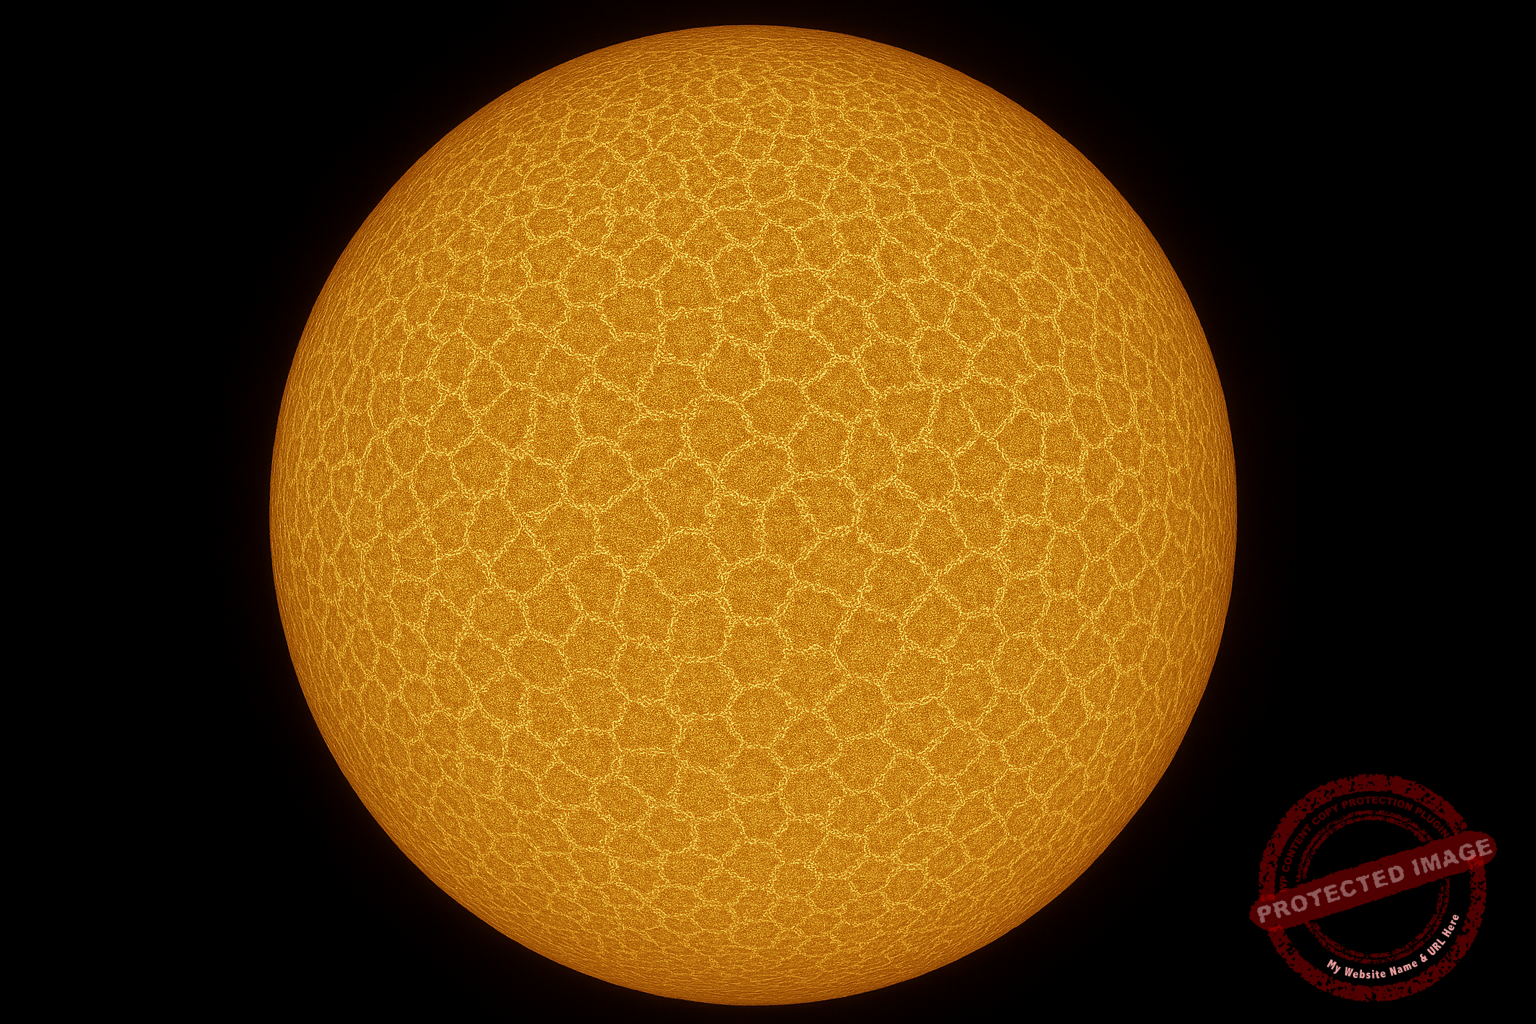
The Sun transports energy generated in its interior through convection in its outer layers, much like boiling water circulating in a heated pot. This process creates various structures on the solar surface, including small-scale granulations and much larger supergranulations that appear as network-like patterns.
These supergranular network cells typically have a lifespan of about 24 hours and measure nearly 30,000 km across, while the cooler intergranular lanes separating them are around 6,000 km wide. Despite decades of research, scientists have continued to puzzle over the origin of supergranulations, the factors determining their size, and their connection with the Sun’s 11-year solar cycle.
A new study by researchers at the Indian Institute of Astrophysics (IIA), an autonomous institute under the Department of Science and Technology (DST), has now provided fresh insights using more than 100 years of observations from the Kodaikanal Solar Observatory.
The study, published in The Astrophysical Journal Letters, analysed nearly 34,000 Ca II K spectroheliogram images recorded from 1907 onward. The observations allowed researchers to examine variations in lane widths and intensities across different solar latitudes over more than nine solar cycles.
The chromospheric network observed in these images forms due to magnetic flux concentration along the boundaries of supergranular cells. Earlier observations from NASA’s Skylab mission in the 1970s had shown that this network extends into the Sun’s transition region as the Extreme UltraViolet (EUV) network before gradually disintegrating in the corona.
Led by Prof. K.P. Raju, the research team investigated how lane widths and intensities correlate with solar activity, particularly sunspot numbers. Using cross-correlation analysis across different latitudes, they identified where the correlation coefficients reached maximum values.
The study found that both lane widths and intensities show strong correlations with sunspot activity, especially around latitudes of ±(11–22) degrees.
For lane widths, the strongest correlation occurred at:
(18 ± 2)° North
(20 ± 2)° South
For intensities, the peak correlation appeared at:
(13 ± 2)° North
(14 ± 2)° South
The findings indicate that no single latitude consistently follows the solar cycle for all measured quantities.
Researchers also observed differences in timing. Lane width correlations peaked during solar maximum, while intensity correlations reached their peak about 1.25 to 1.5 years later, revealing a delayed response to solar activity.
The time lag itself was found to vary with latitude. It was nearly zero around ±20° latitude, decreased toward higher latitudes, and increased closer to the equator. For lane widths, the lag ranged between 0.5 and 0.8 years, while for intensities it varied from 0.3 to nearly 2.5 years.
“Our findings suggest that supergranular properties, such as lane width and intensity, are influenced by local magnetic flux and solar activity levels. The study highlights the importance of understanding these correlations for predicting solar activity and its effects on solar irradiance variations, particularly in the UV spectrum,” Prof. Raju said.
The researchers believe the results contribute to ongoing efforts to understand the origin of supergranulation and its role in transporting magnetic flux across the solar surface.
The study also demonstrates the long-term scientific value of archival observations from the Kodaikanal Solar Observatory, which preserve continuous solar records spanning more than a century. Scientists noted that future observations from the National Large Solar Telescope (NLST), with its advanced high-resolution capabilities, are expected to further improve understanding of supergranular dynamics and solar variability.


