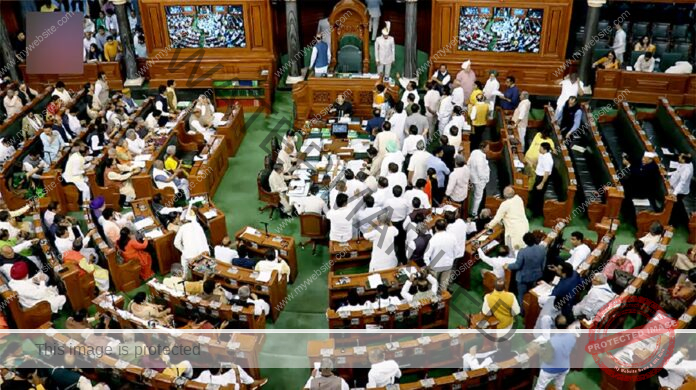
During the 17th Lok Sabha, the Nationalist Congress Party (NCP) five MPs asked the maximum of 410 while Apna Dal (Soneylal) two MPs asked the least of just 5 questions in the entire five-year term of lower house. This was revealed in a report of Association for Democratic Reforms (ADR) released recently.
Other parties on the list of maximum questions asked in 17th Lok Sabha include Shiv Sena (354 questions), AIMIM with 284, the Telugu Desam Party (TDP) with 247 and MK Stalin’s DMK with 243 questions.
The ADR report revealed , parties with the lowest averages were Apna Dal (Soneylal) with 5 questions, Akhilesh Yadav’s Samajwadi Party (SP) with just 7, the Aam Admi Party (AAP) with 27, the National Conference with 29 besides the LJP with 34.
Further, the report revealed, on an average, the BJP MPs asked 149 questions, while the Congress MPs put up 195 questions.
Among other parties, the average of YSRCP MPs was 234 questions followed by CPI(M) 23 besides MPS of Bharat Rashtra Samithi (BRS), formerly known as Telangana Rashtra Samithi (BRS) asked 211 questions. The report mentioned that a total of 92,271 questions were asked by 505 MPs during the entire term of 17th Lok Sabha.
Further, most number of questions asked by the MPs in the Lower House were related to Health and Family Welfare (6,602), followed by Agriculture and Farmers Welfare (4,642), Railways (4,317) and Finance (4,122).
ADR findings mentioned that MPs from Maharashtra asked the most questions (315), while the two MPs from Manipur asked the least of 25 questions.
According to reports, the figures reflect the total number of questions admitted and the questions submitted by the sitting MPs in Lok Sabha. For each of the 543 MPs, a total of 250 unstarred and 20 starred questions are selected from submitted questions with the help of ballots.
ADR report further mentioned that on average, an MP asked 165 questions and attended 189 of the 273 sittings of the 17th Lok Sabha. Among all the full-term Lok Sabha sessions, the 17th had the lowest average annual sittings of 55.
Average Annual Sittings in Lok Sabha
| Lok Sabha | Average Annual Sitting |
| 1st | 135 |
| 2nd | 116 |
| 3rd | 117 |
| 4th | 123 |
| 5th | 105 |
| 6th | 110 |
| 7th | 93 |
| 8th | 99 |
| 9th | 85 |
| 10th | 86 |
| 11th | 80 |
| 12th | 78 |
| 13th | 82 |
| 14th | 66 |
| 15th | 71 |
| 16th | 66 |
| 17th | 55 |


